Juan Arismendi Zambrano, D.Phil. (Ph.D.)
FEDERAL RESERVE CHAIR SENTIMENT (1970 - 2015)
The index presents the market surprise after a Federal Fund Target Rate (FFTR) change announcement, categorized by sentiment of the last Federal Reserve Chair statement previous to the announcement. Jump surprise (J) ratio of difference between FFTR and the U.S. short-term interest rate (1-month Eurodollar) (in %) during the FFTR change announcement. Jump surprise (J) is calculated by the Equation (12). Sentiment is measured by the NLTK Naive Bayes classifier. Jump surprises where the last Federal Reserve Chair (FRC) statement was tagged as "Positive" are in red, and when the last FRC statement was tagged as "Neutral" are in blue. Data sample is from January 01, 1971 to December 31, 2015, and include N = 244 data points (FFTR changes occurred during the period). The index presents the market surprise after a Federal Fund Target Rate (FFTR) change announcement, categorized by sentiment of the last Federal Reserve Chair statement previous to the announcement.

HOW DO WE CALCULATE SENTIMENT?
Our sentiment measurement method follows a machine learning approach, a mixed-approach between, the word by word method, and the proxy function method:9 in line with Li (2010), we use a Naive Bayes classifier that is built on a Bag of Words (BoW) feature set, trained with two widely used datasets for sentiment measurement: a sentiment database (positive/negative tone), and a subjectivity database (neutral/not-neutral tone). This method is widely adopted in the literature of sentiment analysis in machine learning, and in finance since Li (2010), who used it for the first time to measure 10Ks/10Qs reports' sentiment. As a robustness measure, we include the Harvard IV General Inquirer dictionary (Tetlock et al. (2008) from now on) sentiment, and the Loughran and McDonald (2011) dictionary.
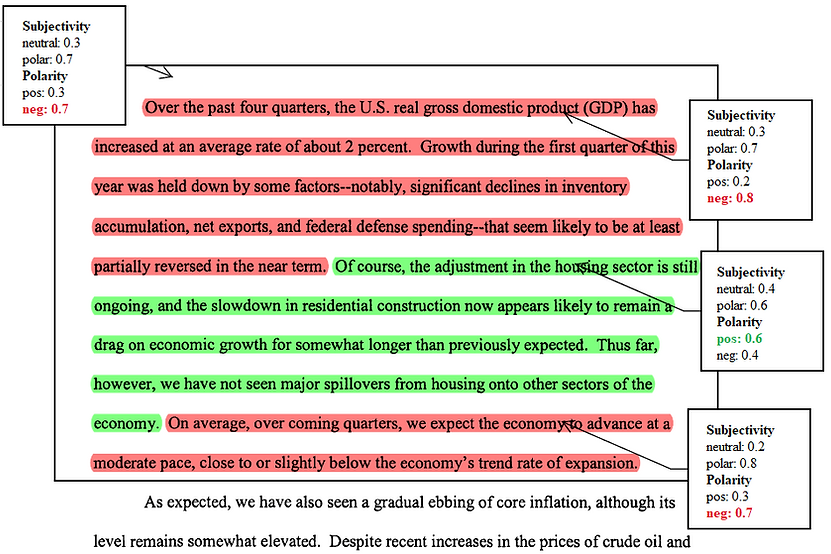
The next two figures show an example of the Naive Bayes sentiment measure with two introductory sections of two different Federal Reserve Chair statements: the first figure shows the sentiment of a section of Fed Chair `Remarks on the Housing Market and Subprime Lending' from the 2007 International Monetary Conference in Cape Town, South Africa, June 05th 2007; and the second figure shows the sentiment of a section of the Fed Chair `Women's History Month Reception' remarks in Washington D.C., US, March 25, 2014:

FEDERAL RESERVE CHAIR IMPACT ON INTEREST RATE
UNCERTAINTY
The next figure shows the resulting average sample entropy growth of the market beliefs, conditional on the sentiment of the Federal Reserve Chair statement released, neutral in gray line, and emotional in blue line, with 95% confidence intervals in shaded gray and shaded blue respectively. The sample entropy growth is calculated between the day before the Federal Reserve Chair statement release, and the next four days: the day of the statement release (t2 = 0), and the next 3 days after the statement release (t2=1,2,3). For the day of the statement release, sample entropy growth has a value different to zero (it is not the starting point of observation), given that we consider closing day prices, and during that day the interest rate closing prices had already been affected. These results show that Federal Reserve Chair statement sentiment is a strong signal for FOMC meeting decisions.


Economists are criticized for not being able to predict the future, but, because the data are incomplete and subject to revision, we cannot even be sure what happened in the recent past. Noisy data make effective policymaking all the more difficult.”
― Ben S. Bernanke, The Courage to Act: A Memoir of a Crisis and Its Aftermath